Characterise Coatings with Raman Microscopy
How to analyse coatings with Raman microscopy – see what types of information you can acquire, with the example of paint and primer layers on metal.
Blue Scientific is the official Nordic distributor for Renishaw Raman in Norway, Sweden, Denmark, Finland and Iceland. For more information or quotes, please get in touch.
Renishaw Raman
Contact us on +44 (0)1223 422 269 or info@blue-scientific.com
Follow @blue_scientificAnalyse Coatings
With Raman spectroscopy you can chemically characterise coatings and layers, and identify materials unambiguously. Measurements provide data about the spatial distribution of materials, with depth profiles and 2D / 3D maps. It’s a highly sensitive technique, capable of resolving sub-micrometre features.
It can be used at various stages of development and manufacturing:
- Materials research
- Final product quality control
- Failure analysis.
Types of Materials
Raman microscopy is suitable for a wide variety of types of materials:
- Organic and inorganic
- Crystalline and amorphous
- Solids (including polytype/allotrope differentiation)
- Liquids
Benefits of Raman for Coatings Analysis
- Ex situ and in situ measurements
- Map curved, uneven and rough surfaces
- Analyse coatings as they expand/contract during curing and in response to environmental conditions
- Non-destructive and non-contact
- Spectral databases for polymers, inorganic materials and more
- Quantifiable data with metrics eg fraction estimates and particle statistics
- Analyse unknown materials with powerful multivariate statistical algorithms
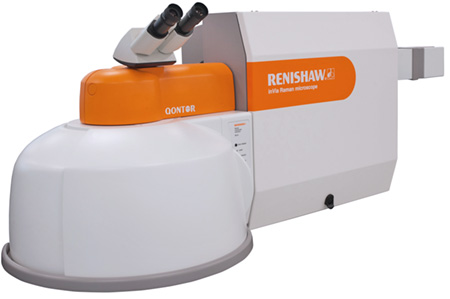
Renishaw inVia
The Renishaw inVia is a research grade confocal Raman microscope, ideal for characterising coatings.
- All types of Raman measurements
- Acquire detailed chemical images and data from discrete points
- Large volumes and traces
- Hihgly sensitive – detect traces and sub-micrometre features
- Automate common tasks to save time
Example: Paint on Steel
In this example, Raman was used to measure paint and primer on zinc-coated steel. The same technique can be used on other types of paints and coatings too. If you’re unsure if it would be suitable for your area of work, please get in touch.
The zinc is coated with ~10 μm primer and ~20 μm paint. It was prepared using ion-beam milling and analysed with the Renishaw inVia.
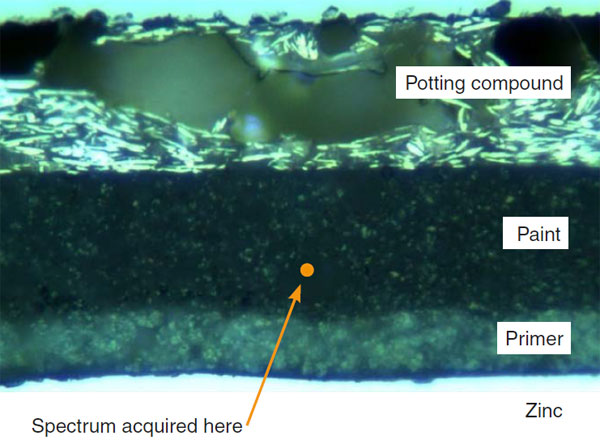
Particle Analysis
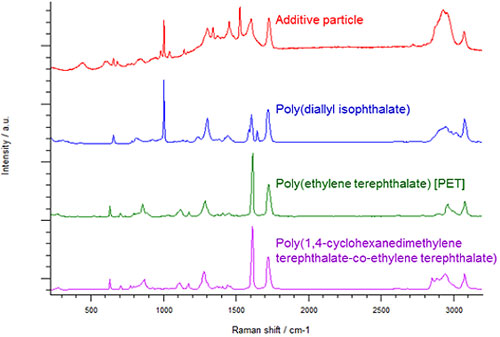
A particle from the paint layer was analysed using Raman point measurement. These particles were not visible after sample preparation, but can be seen in the optical micrograph above.
The inVia is highly confocal, so the spectrum below is representative of the additive, with minimal influence from the surrounding paint. Using Renishaw’s spectral database of polymers, it was identified as a phthalate: poly(diallyl isophthalate) or DAIP, which is a commonly used plasticiser.
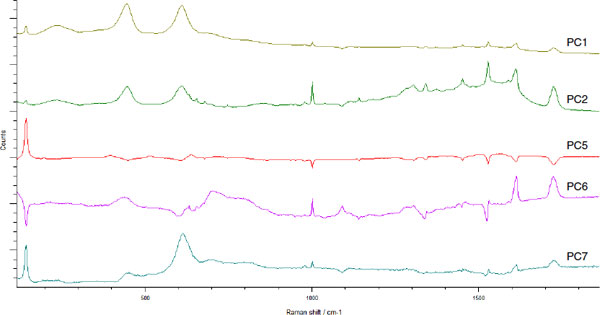
Chemical Mapping
A small 12 μm × 40 μm area of primer was then characterised to determine its components. The chemical map was automatically broken into principle components, in order of significance.
The components were identified as:
- PC1 – TiO2 (rutile)
- PC2 – Phthalate polymer
- PC5 – TiO2 (anatase)
- PC6 – Phthalate polymer
- PC7 – Carbonate
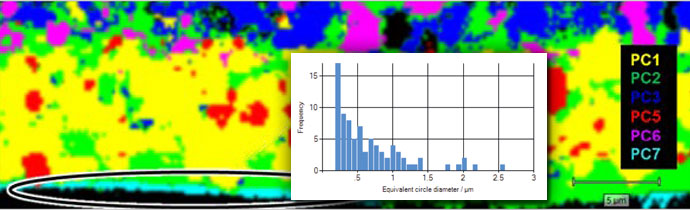
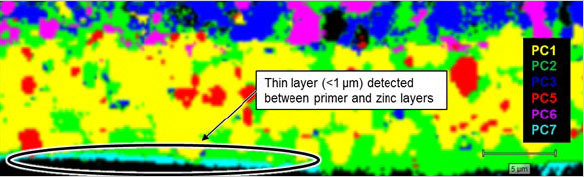
Raman Image
Next a Raman image was generated, to visually depict the distribution of components with colour-coding. Presenting data in this way makes it easy to understand the composition, and is a highly visual way of sharing your results. You can also compare features with the optical micrograph.
The image below shows that the phthalate polymer (magenta) is mainly present in the paint layer. The other phthalate polymer (green) is present in both the primer and the paint. TiO2 (yellow and red) is mainly present in the primer.
The carbonate (cyan) appears only at the interface between the metal and primer; it is most likely zinc carbonate (ZnCO3). The layer is extremely thin (<0.5 μm), so it was only detectable because of the inVia’s high sensitivity and spatial resolution.
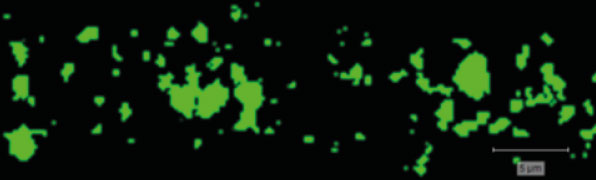
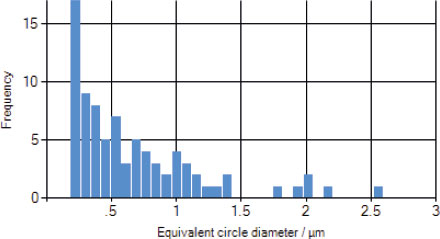
Particle Size
Finally, the anatase TiO2 in the primer was analysed. inVia’s software has comprehensive particle statistics features.
In this case a DCLS (Direct Classical Least Squares) algorithm was used to generate a binarised image, which shows the location of the anatase. This enabled particle identification and size analysis.
The particles were found to be fairly small, with a mean equivalent circle diameter of just 0.9 μm.

These results are available in a PDF application note from Renishaw – available to download here.
More Information
Blue Scientific is the official Nordic distributor of Renishaw Raman. We’re here to answer all your questions – just get in touch: