Raman Imaging and Mapping
Raman Imaging and Mapping
An explanation of the difference between Raman imaging and mapping. The different methods for collecting data and generating images, and their benefits and limitations. Find out what technology and specifications you need to get the best spatial resolution and highest quality results.
Blue Scientific is the official Nordic representative for Renishaw Raman and the InVia spectrometer, which is capable of all the methods in this article. If you have any questions or if you’d like a quote, please get in touch:
Renishaw Raman
Contact us on +44 (0)1223 422 269 or info@blue-scientific.com
What are Raman Images?
Raman images (also known as maps) visually display variations in spectral information at different points on, or inside, a sample. They can be one-dimensional profiles, two-dimensional images or three-dimensional rendered volumes. They are a visual way of quickly seeing how parameters change with position, as well as being a powerful, visual way of displaying your data.
You can display a whole range of parameters, from the intensity of a particular Raman band, or a more complex analysis of the entire spectrum.
There are two main techniques for collecting spectral data to generate images:
- Raman mapping
- Raman imaging
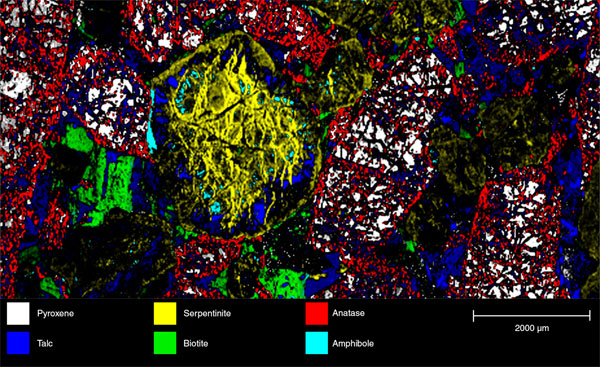
Raman map of a polished igneous rock section, displaying the mineral species over a large area (6 x 5 mm)
Raman Mapping
With Raman mapping, a spectral hypercube is collected, rather than a simple intensity image. This means that a Raman spectrum is taken at each position on the sample in a single file. This is then analysed to produce Raman images.
There are several methods, including:
- Point-by-point mapping
The laser is focuses on one spot, and the sample is moved by a motorised stage. Spectra are acquired sequentially from a range of points, across a specified area of interest. This can be done quickly with Renishaw’s Fast StreamHR™ and StreamHR Rapide technology. - Line focus mapping
Similar to point-by-point mapping, but with the laser illuminating a line on the sample, instead of a spot. Spectra can be collected from multiple positions on the sample at the same time, so it’s faster. Higher laser powers can be used without damaging the sample, because the exposure time is shorter. Line focus mapping can be performed with Renishaw StreamLine™ technology.
Mapping Graphene with StreamHR Rapide
Undersampling
To get the best results from Raman mapping, it’s important to avoid undersampling. With point-by-point mapping in particular, it’s easy to miss parts of the sample if the spacing between acquisition points is larger than the laser spot. Renishaw instruments feature a unique StreamLine™ Slalom mode to avoid this problem.
From Map Data to Images
Once the spectra have been collected, they can be analysed in various ways to produce profiles, images or rendered volumes, including:
- Intensity at a single frequency in the spectrum
This creates results similar to Raman imaging. A fast method, but it’s important to be careful when analysing results; intensities caused by a Raman band of interest can look the same as those associated with a broad background fluorescence. - Curve fit parameters
Every spectra in a set has a theoretical curve fitted to one of the Raman bands. Images are created using the theoretical curve parameters for each spectrum. This indicates the stress or crystallinity within the sample, using the centre frequency of the curve (band), or the full width at half maximum (FWHM). - Multivariate parameters
Images are generated using chemometric tools, such as generic Principal Component Analysis (PCA), or Renishaw’s Empty Modelling™ tool, which is optimised for Raman data. Empty Modelling reveals systematic variations between the Raman spectra, and displays the distribution of these variations across the sample as an image. Prior knowledge of what is present within the sample is not necessary. Multivariate analysis is very powerful because it uses information from the entire spectrum, rather than just one part (intensity at one frequency) or one curve-fitted band. Images created using this method are usually higher quality.
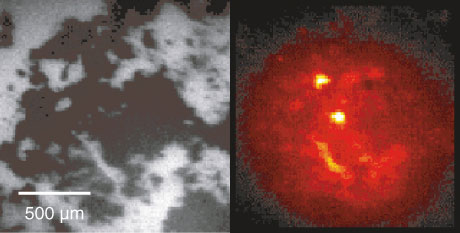
White light and Raman image of a mixture of cocaine and sugar. Taken using fast Raman imaging, the cocaine particles are highlighted as bright spots.
Raman Imaging
In contrast to Raman mapping, Raman imaging is like taking a photo; Spectral intensity values are collected simultaneously from the whole region of interest. The laser illuminates a square or circular region on the sample. Light is filtered, to record the intensity of just one narrow part of the spectrum.
This limits the information collected to the intensity of the light at that frequency. However, the benefit of this method is that images are faster to acquire. Especially with high power lasers; light is spread over an area, so higher power can be used without causing damage. This also shortens exposure times.
Raman imaging usually creates 2D images. Renishaw’s True Raman Imaging mode is useful for collecting data quickly, or analysing a large number of samples when you don’t need particularly detailed information. Collect just the data you need, choosing a wavelength to reveal the distribution of a particular chemical species.
It’s also possible to collect intensity values from multiple points of the spectrum by using multiple and/or tuneable filters.
How to get the Highest Resolution
Point-by-Point Mapping
Spatial resolution is determined by:
- Laser spot size
Higher magnification and shorter laser wavelengths produce smaller spot sizes and therefore higher resolution. - Spacing between acquisition points
Sample stages should ideally have a large travel range and a step size smaller than the smallest spot size.
Raman Imaging
With imaging, resolution depends on the magnification optics in the system and the size of the elements in the detector. Ultimately this is limited by the inherent wavelike nature of light, to just under a micrometre.
Further Information
If you’d like to know more about imaging and what’s possible with the Renishaw InVia, just get in touch: