Combining Raman Spectroscopy and Nanoindentation
Combining Raman spectroscopy and nanoindentation delivers correlated mechanical and chemical information about your material. With a combined system, you can take both measurements in-situ without transferring your sample, for perfectly correlated data. Both systems can also be used independently as you need to.
Blue Scientific is the official Nordic distributor for Renishaw Raman and Bruker Nano Surface Analysis systems in Sweden, Norway, Denmark, Finland and Iceland. For more information or quotes, please get in touch.
Renishaw Raman
Bruker Nano Surface Analysis
Contact us on +44 (0)1223 422 269 or info@blue-scientific.com
Follow @blue_scientificRaman and Nanoindentation
Raman spectroscopy is a powerful analytical technique for studying materials, providing information about composition, uniformity, stress, strain and disorder. However, Raman is not able to directly characterise physical, mechanical or tribological properties.
By combining Raman spectroscopy with nanoindentation, you can correlate mechanical and tribological properties with chemical information including crystallinity, polymorphism, phase, stress and strain:
- Nanoscale indentation, scratch and wear
- Mechanical and tribological properties
- Surface topography imaging with in-situ SPM
- Chemical and structural properties
How to Combine Raman and Indentation
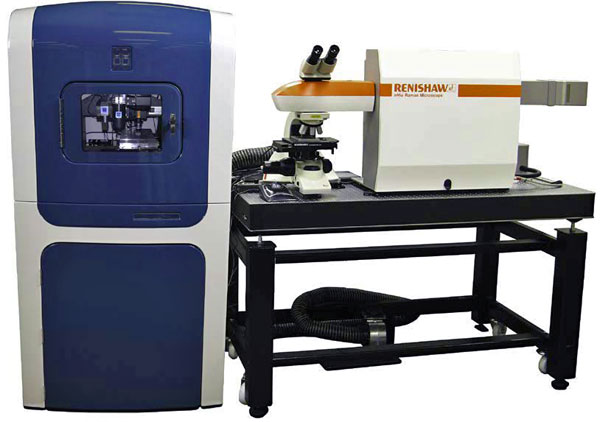
The Renishaw inVia confocal Raman microscope can be combined with the Hysitron TI950 TriboIndenter, enabling you to correlate mechanical properties with full chemical analysis, in-situ.
The two systems are coupled using fibre optic technology, for a perfectly combined system, and firmly mounted on a granite bridge.
This means you can measure the same location on your sample with indentation and Raman spectroscopy, without having to transfer the sample between instruments and relocate your region of interest. You can acquire:
- Optical white light images
- SPM images
- Raman point spectra
- Raman images
- Nano- and micro-indentation data
Both the inVia and nanoindenter can be used independently or simultaneously as you need to, without compromising the performance of either system.
By using both analytical techniques, the correlated data delivers greater insights into your material’s mechanical properties and deformation behaviour at the nanoscale and microscale.
Example: Diamond-like Carbon
Diamond-like carbon (DLC) is a metastable amorphous type of material. The wear resistance, very low coefficient of friction, hardness and elastic modulus of DLC films can be comparable to diamond. Its mechanical, chemical, tribological, optical and electrical properties depend on the abundance of sp3 and sp2 bonds in the structure.
The complementary mechanical and chemical data from indentation and Raman can deliver a better understanding of the material.
In this example three DLC films were deposited on silicon wafers with various deposition techniques. Raman point spectra were taken, then indentation curves to measure the hardness and modulus. The indentation curves of the three coatings correlate with the variations in their Raman spectra.
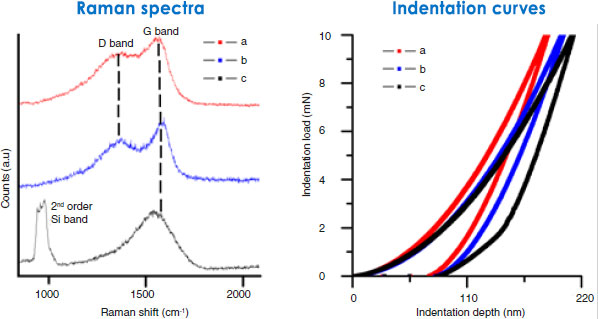
Sample c (black) is the thinnest film at 40 nm. It’s also the softest, so the indentation is affected by the softer silicon substrate as well as the harder DLC film. This causes the ‘elbow’ in the unloading section of the curve. The thinness is also indicated by the silicon in the Raman spectrum, from the substrate, showing that light can penetrate the thin coating.
Example: Wear Testing
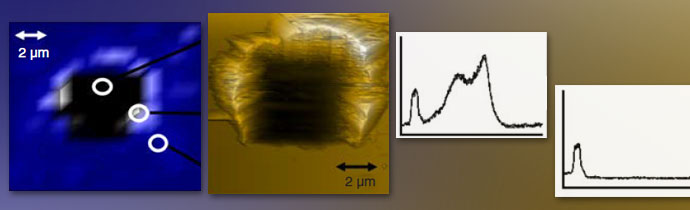
Sample c was then tested further with a wear measurement, using a Berkovich indenter. It was moved across the sample five times at a 1 Hz rate, with 500 μN normal force to create a wear pit. The optical, SPM (Scanning Probe Microscopy) and Raman images are below. Raman spectra were also acquired from inside the pit, the edge and from the unaffected surface.
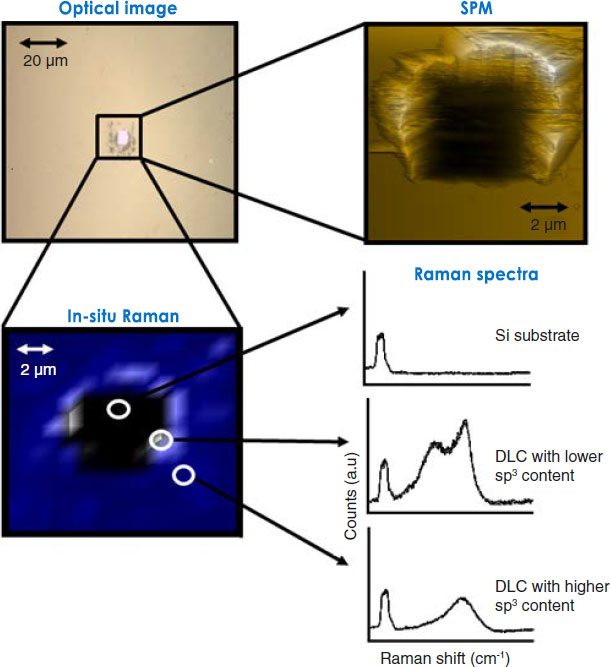
The lighter section in the middle of the optical image, and the height change revealed by SPM indicate that the film has been worn away at the bottom of the pit, exposing the silicon substrate. The Raman spectrum confirms this, showing the presence of silicon instead of carbon.
You can see debris at the edges of the pit, and an increase in height in the SPM image. The Raman spectra from the edge of the pit and the plain surface show an additional peak from the debris, from disordered carbon. This shows that the process moved the coating material to the edge of the wear pit, and the deformation transformed the structure from predominantly sp3 to defective graphitic sp2.
Further information about these tests is available in an application note from Renishaw.
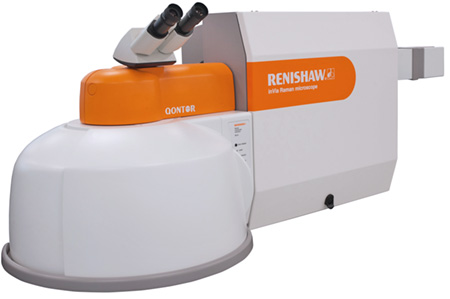
Renishaw inVia
- Research-grade confocal Raman microscope
- Perform all types of Raman measurements
- Detailed chemical images and unambiguous Raman data
- Flexible platform with optional lasers, components and accessories
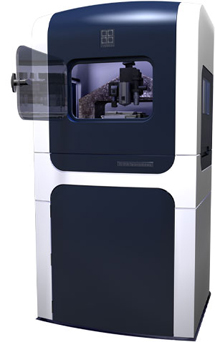
Bruker Hysitron TI 950 TriboIntenter
- Quantitative nanomechanical tester with in-situ SPM
- Wide range of characterisation techniques
- Unprecedented sensitivity
More Information
Blue Scientific is the official Nordic distributor of Renishaw Raman and Bruker Hysitron nanoindentation systems. We’re available to provide quotes and answer all your questions – just get in touch: