Testing Thin Films and Coatings with the Bruker UMT TriboLab
Testing Thin Films and Coatings with the Bruker UMT TriboLab
Test the material properties of thin films and coatings with the Bruker UMT TriboLab. Perform a wide variety of mechanical tests on thin films and coatings including:
- Nano- and micro-indentation tests for coating nano/micro-hardness and elastic modulus evaluation
- Scratch-hardness tests under constant load for scratch resistance and hardness measurement
- Scratch-adhesion tests under progressively increasing loads to evaluate coating adhesion and scratch toughness properties
- Slow reciprocating wear tests to measure coating friction and durability
- Detailed imaging with Atomic Force Microscopy (AFM) or optical microscopy
The Bruker UMT TriboLab is a comprehensive, versatile materials testing system for measuring mechanical and tribological properties; Perform practically every common tribological test on nano and micro scales.
Blue Scientific is the official distributor of Bruker tribology instruments in the Nordic region (Norway, Sweden, Finland and Denmark). If you have any questions or would like a quote, please get in touch:
Contact us on +44 (0)1223 422 269 or info@blue-scientific.com
More about the UMT TriboLab
What Can You Test?
Perform a wide variety of nano and micro mechanical tests on practically any type of thin film or coating, including metals, ceramics, composites, polymers and more. Test materials for semiconductors, solar panels, displays and LEDs. If you are unsure whether the TriboLab would be suitable for your area of work, please get in touch.
Nanoindentation in Optoelectronics and Ceramics
Multi-phase and porous ceramic materials are used as passive semiconductors in optoelectronic devices. Pre-screening critical parts for subsurface defects before assembly can prevent failure in the field. Using nanoindentation, the shapes of loading–unloading curves can indicate sub-surface cracks and defects caused by material porosity and inelastic behaviour:
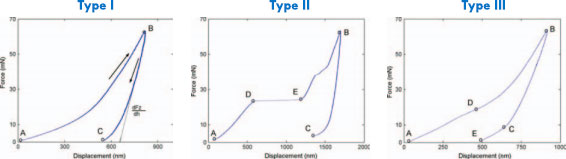
Loading-unloading curves indicate sub-surface defects: Type I – no defects; Type II – indicates a crack; Type III – inelastic response due to possible air bubble beneath the surface
Scratch-Hardness Testing
The scratch hardness of a material can be assessed by scratching the sample’s surface with a sharp, hard tool with known tip geometry, under a constant load. By measuring the scratch width, the scratch hardness can be calculated.
In this example, micro-scratch-hardness tests were performed on two samples using a diamond stylus with a tip radius of 5μm. The test was conducted with reference to ASTM standards. The test used a diamond stylus and an acoustic emission sensor, to monitor the high-frequency signal generated during scratching, indicating the intensity of the fracture.
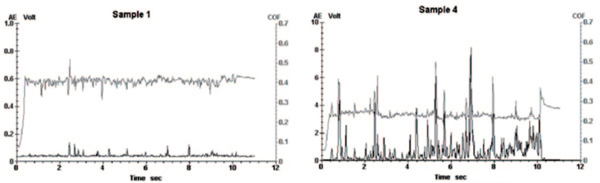
Friction coefficient (grey) and Acoustic Emmission (black) signals during micro-scratch tests
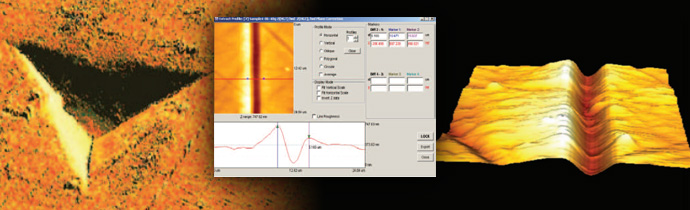
The scratch width was then measured using an AFM head, and AFM images of the scratches were taken:
3D AFM images of the scratches at a scan size of 25μm x 25μm.
The table below shows the mean coefficient of friction (COF) and acoustic emission (AE) values for both samples, along with the scratch width (W) and scratch hardness:
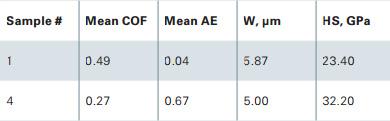
Micro-scratch test data with diamond stylus.
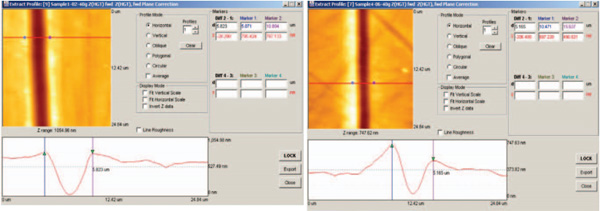
Screenshots of scratch width measurement
Scratch-Adhesion Testing
Similar to scratch-hardness testing, scratch adhesion tests use a micro-indenter or a micro-blade, sliding and a linearly increasing load. The failure of the coating is characterised by a sudden change in coefficient of friction (COF) or contact acoustic emission (AE). The adhesion strength of the coating or thin film is characterised by the load at which COF and AE exhibit a sudden change.
In this example, scratch-adhesion tests were performed using a diamond stylus with a 12.5μm tip radius. The sliding speed was 0.5mm/s over a distance of 10mm on a patterned LCD display with a coating layer sequence of indium-tin-oxide/ overcoat/matrix on a glass substrate. At the point of failure at a load of around 16mN, both COF and AE increased. The periodic bumps in the COF and Fz plot were due to the rapid interaction of the diamond tip with the patterned top surface of the specimen.
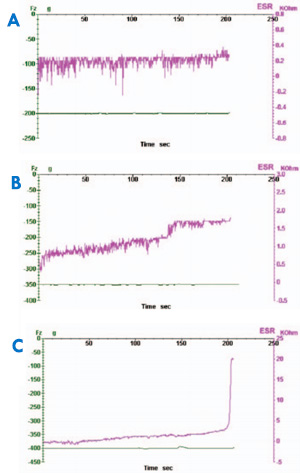
Example wear test data: A – at 2N the coating is not broken; B – at 3.5N the coating starts to break; C – at 4N the coating breaks but does not completely cut through.
A series of runs is performed with progressively increasing normal loads, until coating failure was observed. The critical load characterising the coating scratch resistance is defined as the minimum load required to break through the coating completely.
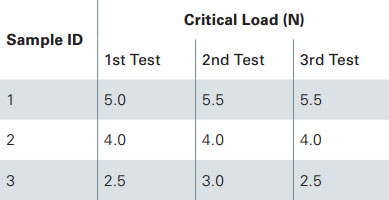
Scratch test results
Wear Testing
In wear testing, the indenter is stationary, with sample stage reciprocating to cause coating wear. A constant load for the wear test can be chosen according to the results of the scratch test, and the critical load required for coating failure. The goal is to determine a load that will stress the material without breaking through straight away.
After the load is applied, the sample is cycled in a reciprocating motion until the coating wears through. Coating wear resistance is defined as the minimum number of cycles required to wear the coating through completely.
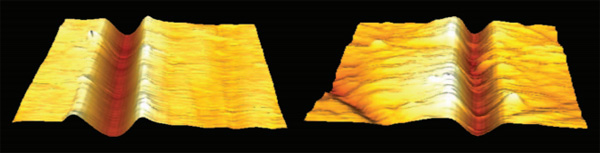
The results for three different LCD samples are shown below. These correspond with the scratch data; samples showing the highest resistance to break through also exhibit the highest resistance to wear:
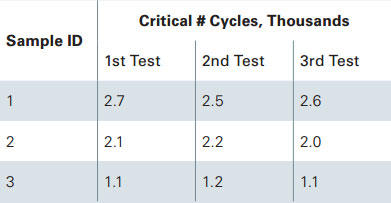
Wear test results
Testing Tribological Properties of DLC Films
The wear-resistance of monolithic materials can be improved with diamond-like carbon (DLC) thin films. DLC thin films are used in rigid discs and microelectronic-mechanical systems (MEMS) as protective coatings for wear-resistance in light load and high velocity conditions.
In this example, the variation of frictional coefficients over time was measured using an Al2O3 ball against Si substrate. The test was repeated with and without a DLC film (approx. 250nm thick). The bare Si substrate sliding against the Al2O3 ball shows a frictional coefficient as high as 0.40–0.60. During the test, debris was visible after just a few sliding cycles, showing that the Si substrate had poor wear resistance. In contrast, the DLC film shows a much lower steady-state frictional coefficient of 0.13, even after two hours under the same test conditions.
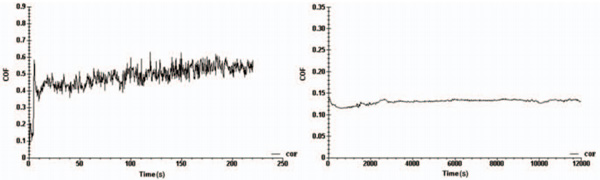
Variation of friction coefficients with sliding time. Left – without DLC film; Right – with 250nm DLC film
These tests provide invaluable data in evaluating the benefit of friction-modifying coatings. Relative performance improvements can be determined using different coating types.
Bruker UMT TriboLab: Modular System
All of these tests and more can be performed with the Bruker UMT TriboLab. The system is modular, so drive stages and sensors can be swapped easily to reconfigure the instrument for different tests.
- Instantaneous detection with high-frequency multi-channel data acquisition, data is sampled at thousands of times per second, to detect tiny submicro-contact and submicro-failure events.
- Integrated optical microscopy is available for precision sample micro-positioning, videos of surface failure and micro-images of wear tracks, indents and scratches.
- Optional integrated atomic force microscope and profilometry for higher resolution imaging and quantification of test surfaces, wear tracks, indents and scratches, both periodically during testing and post-test.
Full details of the example tests mentioned here are available in this application note from Bruker.